Hello,
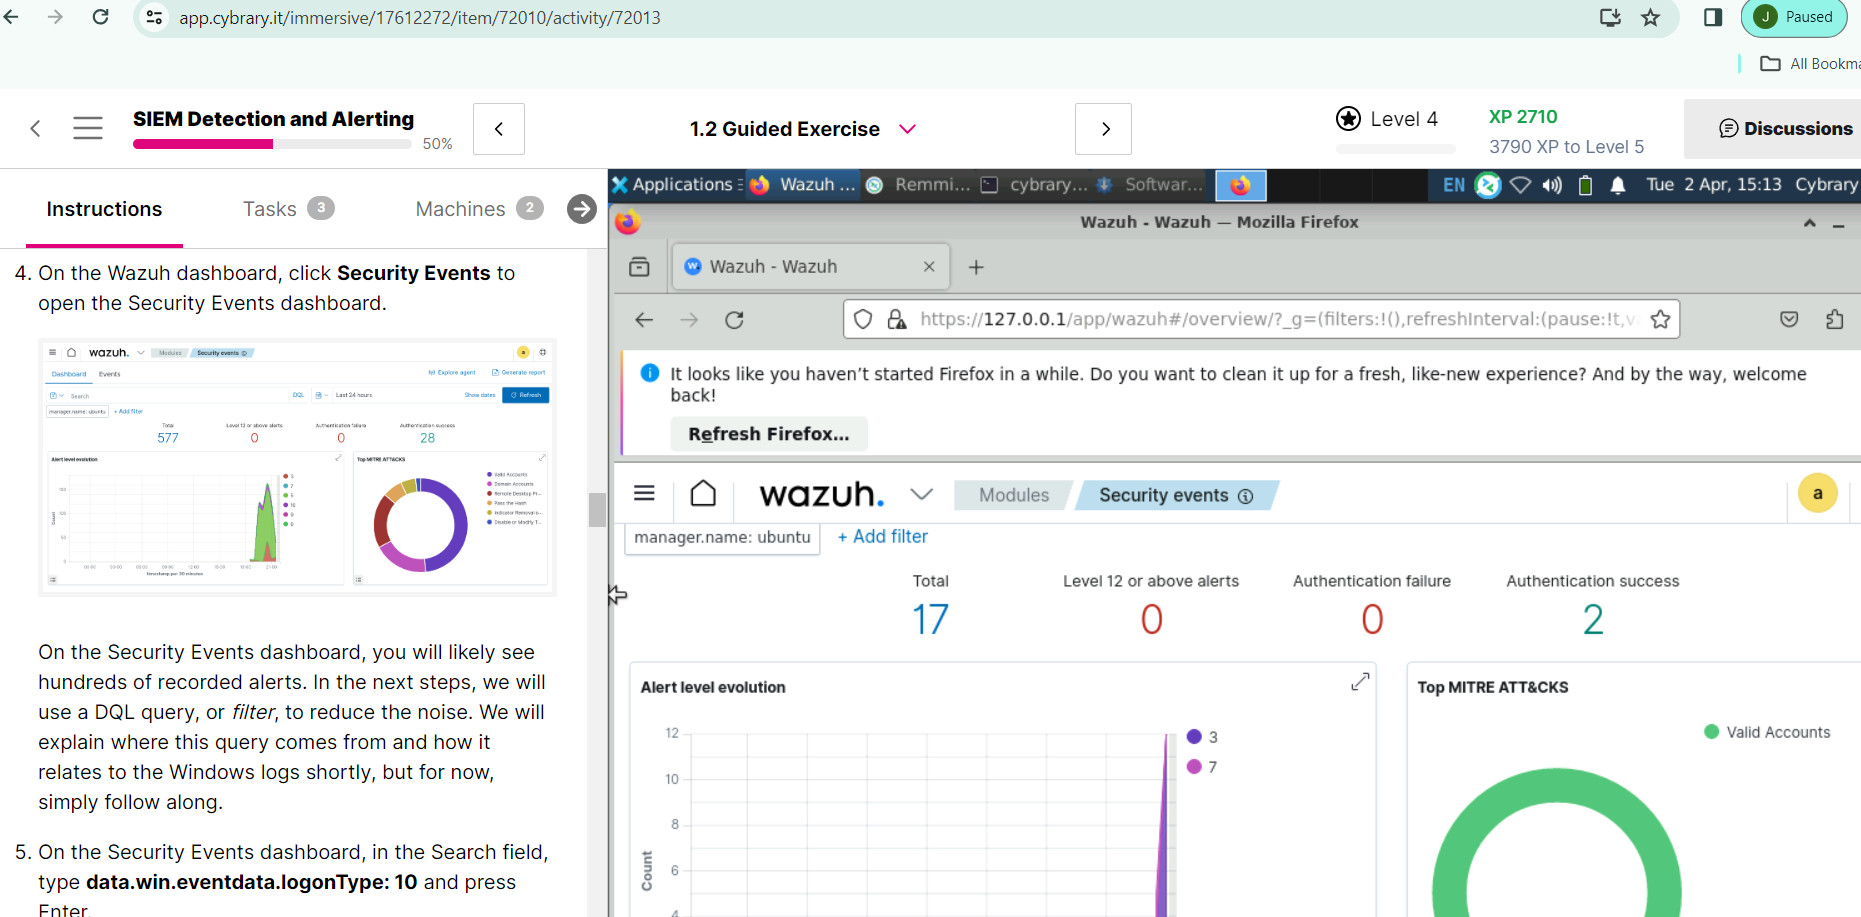
I’ve been experiencing an issue with my dashboard where the number of alerts is not updating as expected. According to the instructions, there should be 577 alerts, but I’m only seeing 17. This discrepancy is affecting my ability to create a rule in Wazuh and generate a ticket. Despite completing the rule and being able to view filtered tickets, I’m not able to find the specific ticket mentioned in the instructions.
I’ve attempted this process three times, but the issue persists. I’m wondering if the initial discrepancy in the number of alerts is causing this problem. However, it doesn’t make sense to me because I was able to create the rule and view the tickets, just not the specific one required.
Has anyone else experienced a similar issue or have any insights into what might be going wrong? Any help or suggestions would be greatly appreciated.
Thank you.
im having the same issue except I either get 12 or 19. plus im not getting the log in alert type 10 on it.
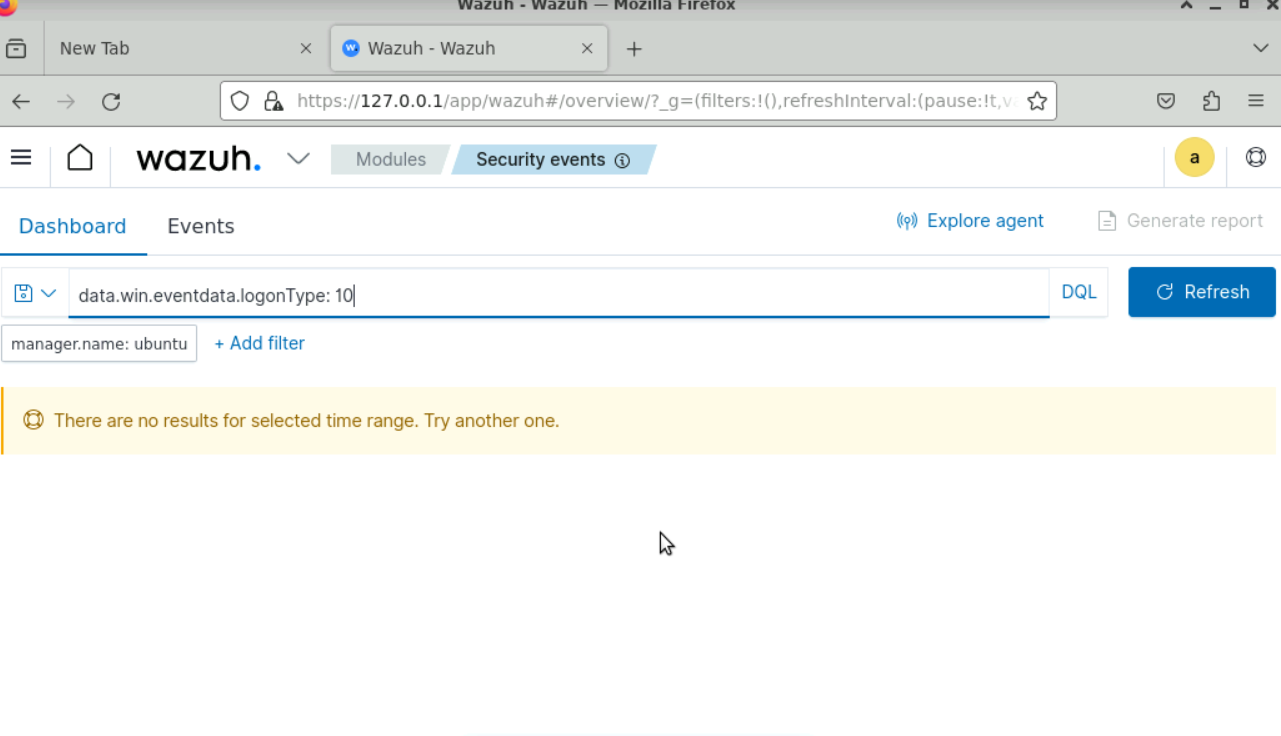
Where you able to find a work around to this? I am experiencing the same issue currently. I only have 15 events and when I query for data.win.eventdata.logonType: 10 I get the below message.
Hey there - if you’re not getting any results at this step in Part 2, you likely need to revisit Part 1. All of the event data used in Part 2 is generated by the RDP connection you make in Part 1.
2 Likes
Hi,
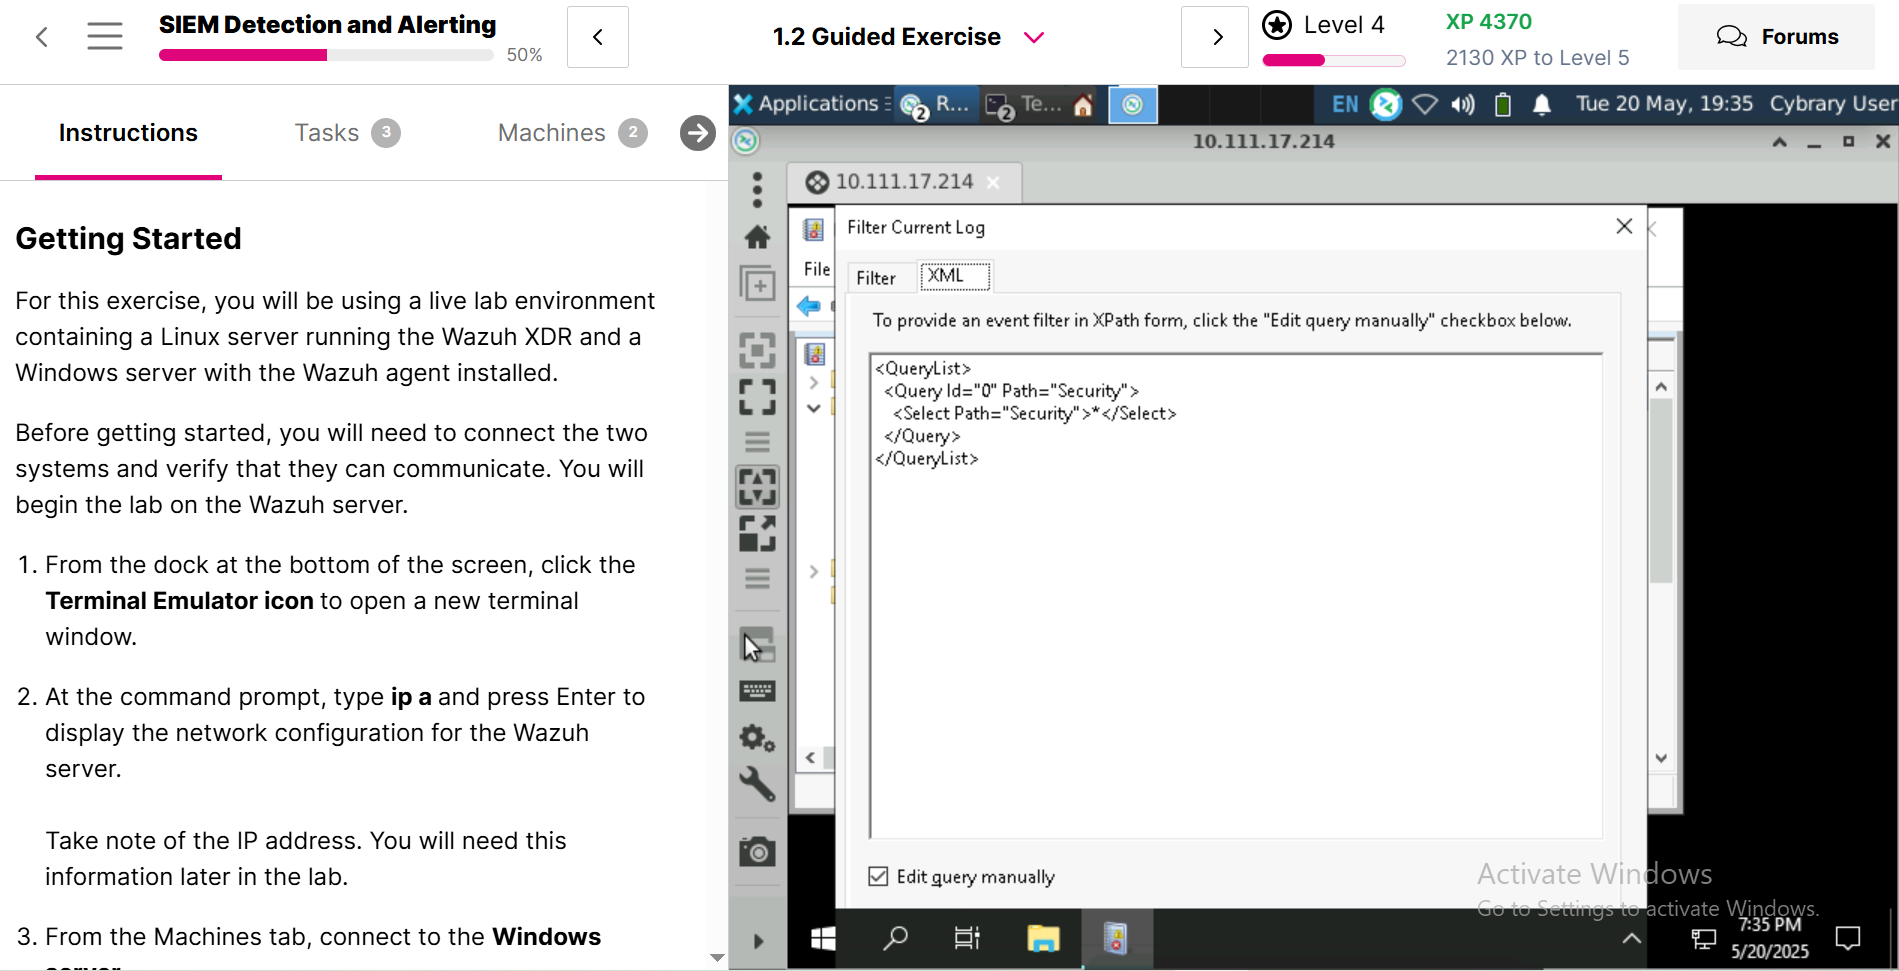
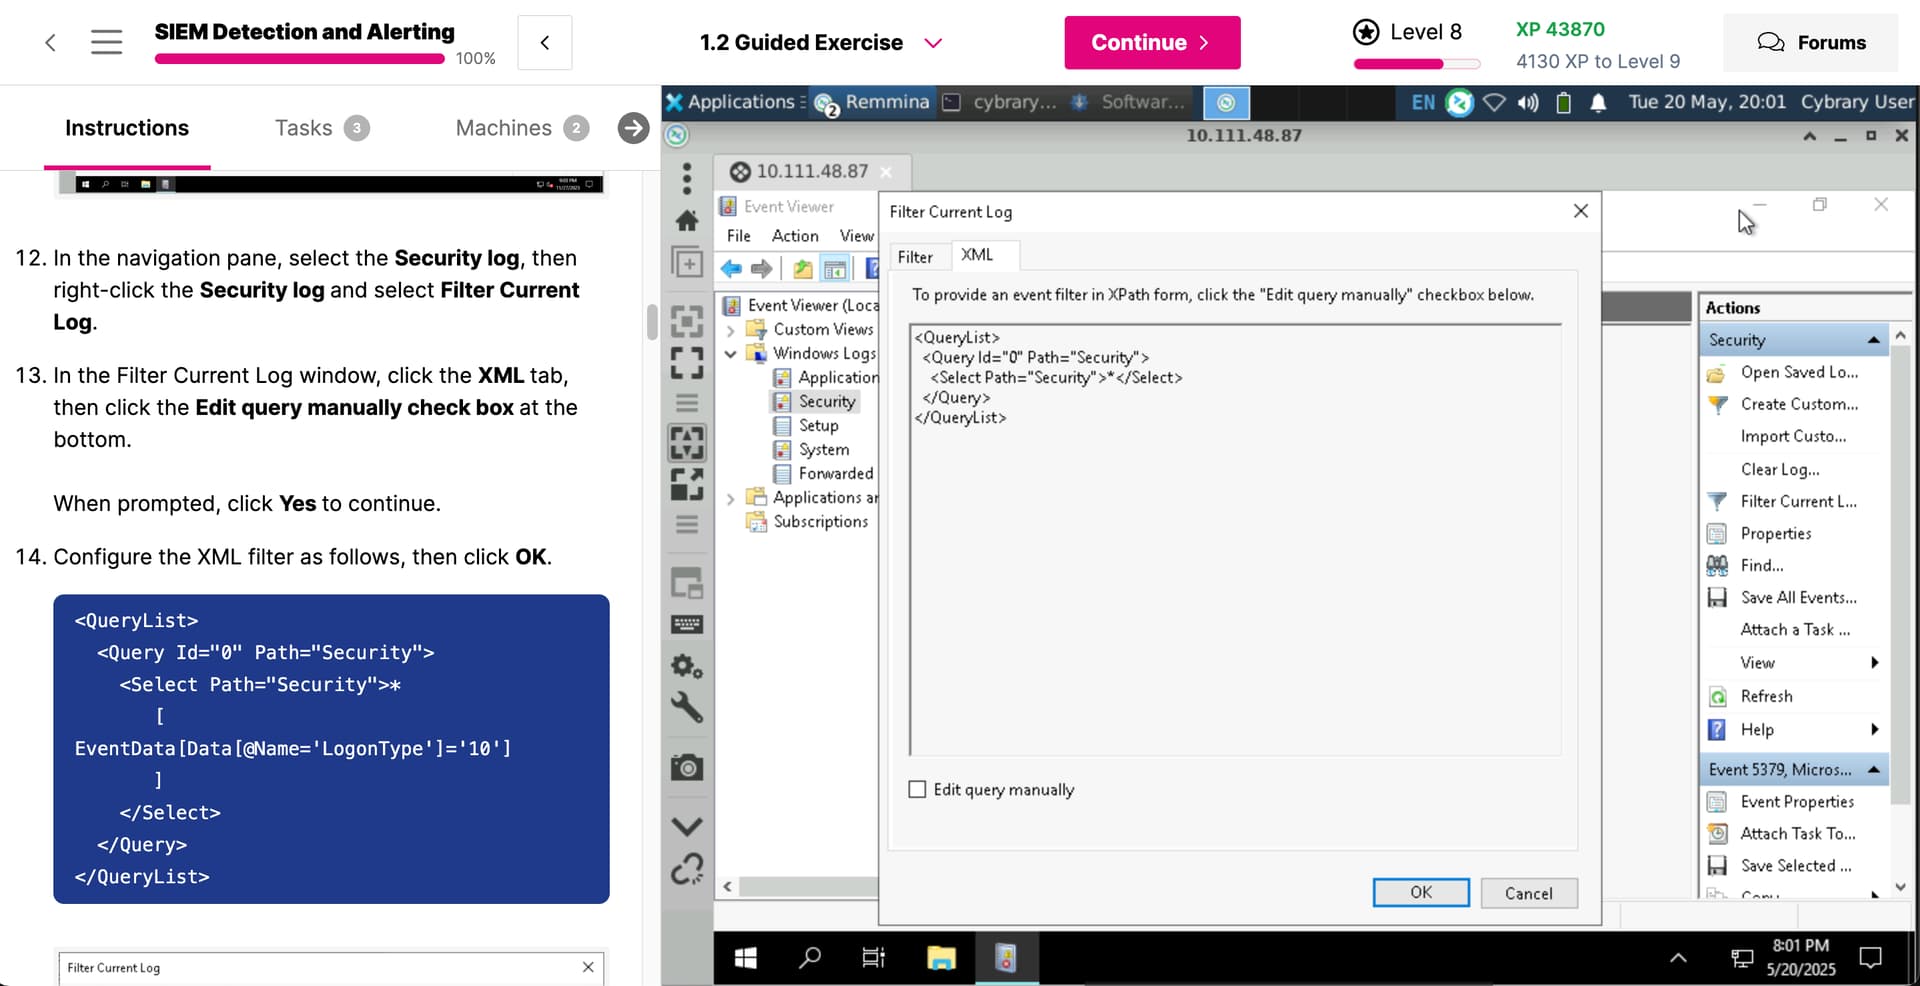
I’m unable to click ok in my RDP Event Viewer to configure the XML filter. Th OK button seems to be out of screen view and unable to scroll to where it is. Can you please help?
Hey there - if the OK button is getting cut off, I would recommend entering Full Screen mode in your local browser.
I did that. Still can’t get it
What size device are you using? I was able to get it to work on a 13.3-inch screen (default resolution 1440 × 900) using Chrome before entering Full Screen Mode in Chrome (see attached).
You can also try going into your device’s Display settings and increasing the resolution.
I was able to figure it out. hank you very much for your help 
1 Like
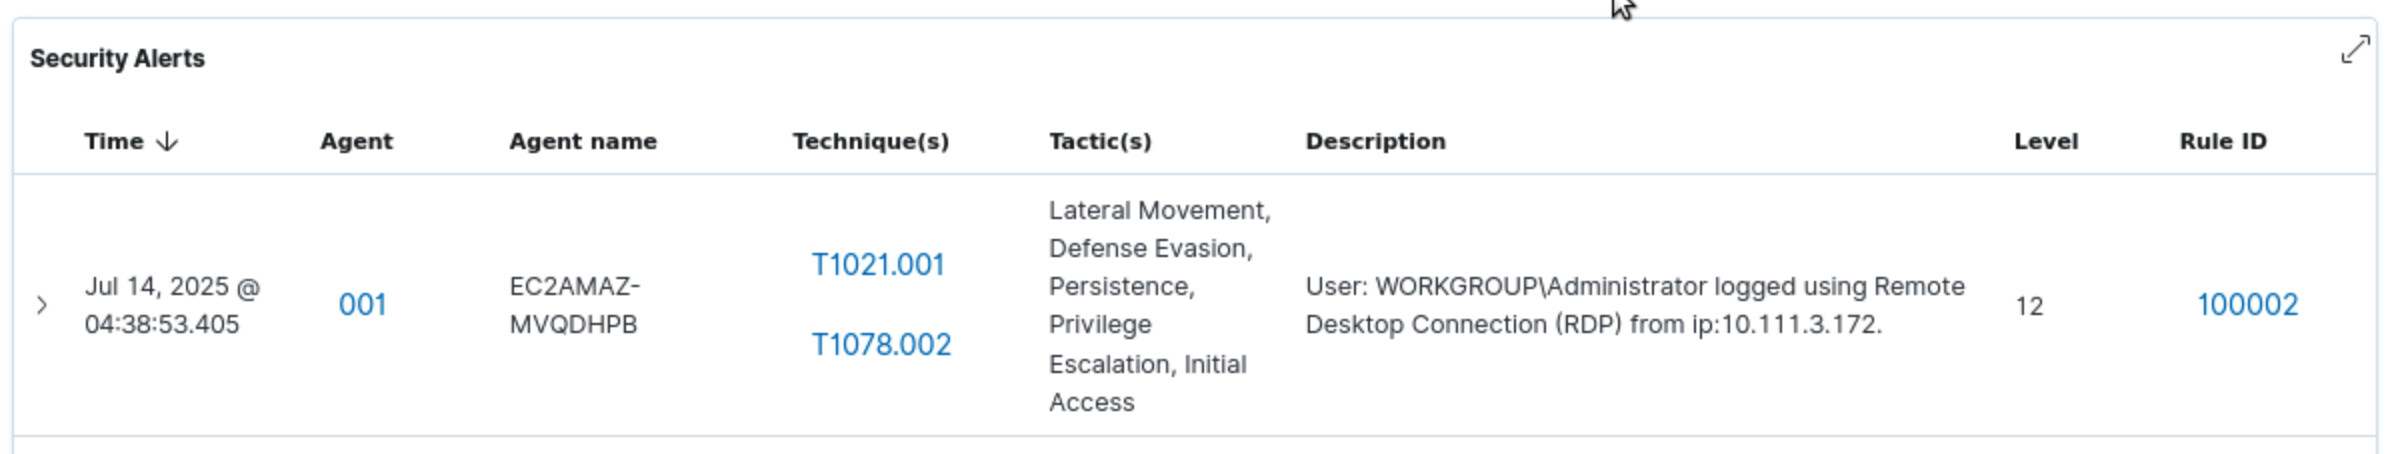
i am currently stuck on the 1.2 Guided Exercise for this lab. i was able to successfully edit the rule to trigger a level 12 alert in the SIEM, for rule ID 10002 as explained in the lab.
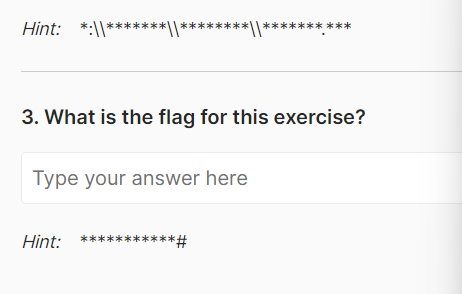
in step 20 it reads “In the last step, you will run a scoring script that will determine if you edited the SIEM rules correctly.” when I run sudo /lab-flag.sh it asks me for a password, but I do not see any password given and I’ve tried several different passwords. i’m not sure what i’m doing wrong but i can’t seem to open the lab-flag.sh to obtain the flag for Tasks question 3.
any help would be greatly appreciated!
UPDATE: I was running sudo /lab-flag.sh instead of running sudo ./lab-flag.sh  i was able to finally figure it out and get the flag.
1 Like