Not exactly sure how to answer question 2 of the Guided Exercise for the “Malware Analysis Basics” course. I tried the Hex values at the location, I tried converting values separated by null bytes into decimal values, etc. Any idea what is expected or how to arrive at the correct answer?
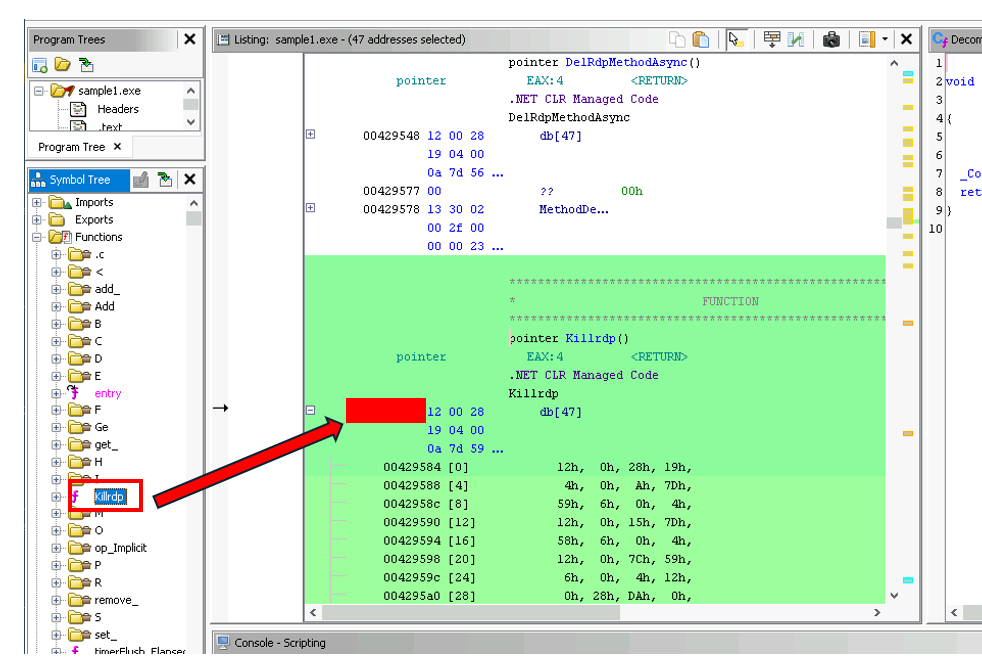
The question is asking for the memory address of the start of the killrbp function decompiled in Ghidra.
I have a problem looking for the first IP address in “Sample 1”, I have done all the procedures but I can’t see the sample in the list of each process. Can you help, I need badly help on this. Thank you
Hello I’m having an issue with a step in Malware Analysis Basics. I’m not sure if this step is flawed. “4. In the Process Monitor, click the red trash can icon to clear the Process Monitor, then immediately double-click the malicious sample1.exe file to detonate the malware.” I’ve attempted this step numerous times on the past 2 hours and I’m unable to locate. Is it a path I’m missing or is this step flawed?
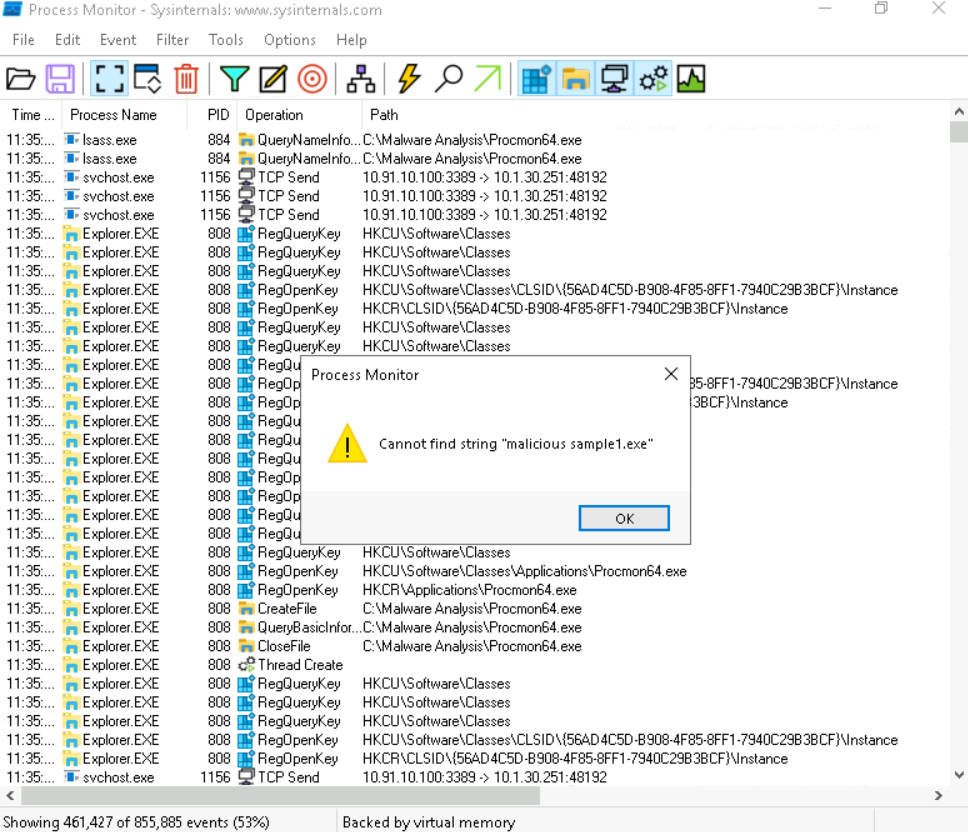
Hey there - to clarify, that’s the malicious sample1.exe file on the Windows desktop. Are you launching that file from the desktop, or clicking on something within the Process Explorer to generate that error message?
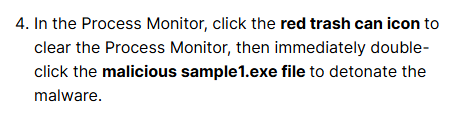
I think it should just say sample1.exe, as this is the same file you have been working with the rest of the lab. I think “malicious” is just a description and should not be bold ![]()
I found it thank you all. I miss read the location. I was looking in the tool for it. And not clicking and dragging on the file from “desktop” to the tool.
1 Like
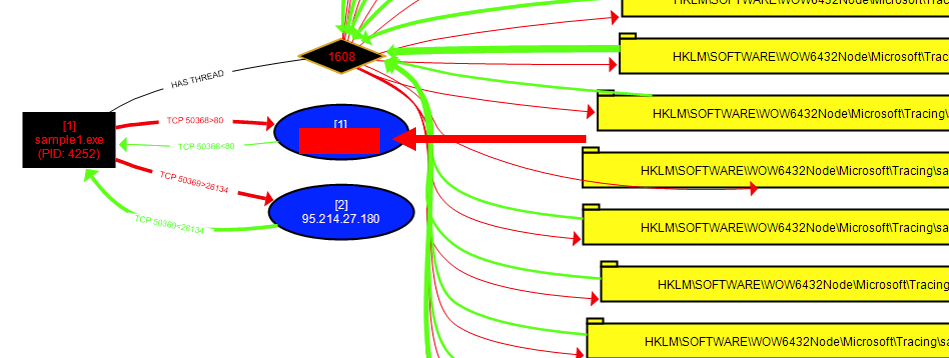
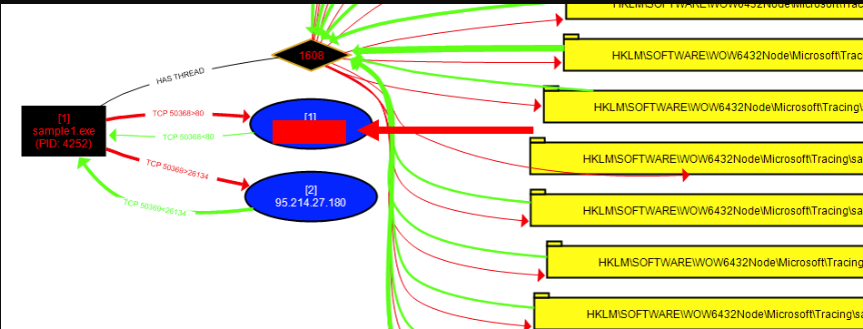
Can you please let us know the first IP address that the sample1.exe malware attempted to connect to? I tried everything possible but not but unable to get the graph.
Can you please let us know the first IP address that the sample1.exe malware attempted to connect to? I tried everything possible but not but unable to get the graph.
Could you please provide a screenshot of what you’re seeing?
I am not getting this graph and hence unable answer the question which asks for the IP address. Please let me know if you know the answer.
I know the answer, but posting it here would defeat the purpose of the lab ![]()
I can confirm that this lab works as expected as long as you’re following all of the steps correctly. If you’re not seeing the graph, it means you’ve likely missed a step somewhere. Could you please provide screenshots at the following steps?
-Part 2, Step 8 [confirming successful malware detonation]
-Part 2, Step 17 [confirming successful refresh of procdot with correct log file and process selected in the Monitoring Logs and Render Configuration fields]
1 Like
I am unable to get the sample1.exe” process to terminate. As a result, the csv files shows that it will take 6 hours to complete. When I try to terminate and then confirm the termination it gives an error message that it cannot be terminated. The process pops up then disappears. how to complete the lab? this is a walkthrough and should not be this difficult.
I was able to replicate. I’ve run this lab probably dozens of times in the past few years, and it seems like something has changed in the behavior of the malware, where it intermittently appears and disappears in the Process Hacker view. I’ll flag this to the instructor.
Actually, I was able to grab and terminate the process on my most recent attempt, but something still seems to have changed recently.
The malware sample can no longer reach an Internet resource it needs, so it kills itself and then respawns to try again. I have updated (and simplified) the lab steps to reflect this new behavior.