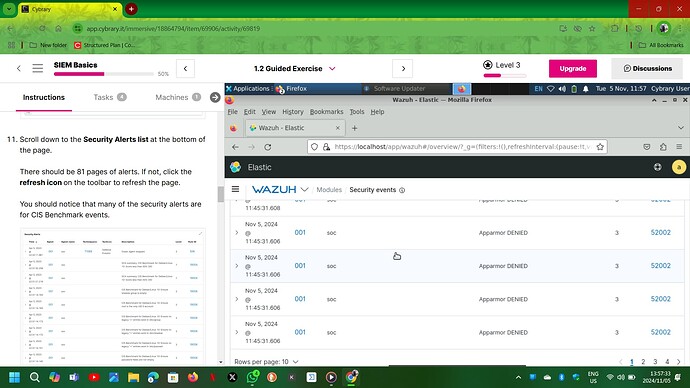
when login to Wazuh i get different number of alerts the the instruction and i cant find alerts that are in the instruction. i just cant advance any more because of that.
any help?
leo
Were you able to finish it, if yes how? i am stuck in the same situation. Wazuh does not show any RDP logins.
I’m in the same situation, and now it won’t load the lab at all. Anyone know what I should do next?
Okay I got through it now, anyone else need help still?
i do!! im stuck in the area where im looking for the login type 10 on wazuh and nothing, even after doing everything else
For me, I realized I forgot a number in the IP address earlier in notepad…
I’m stuck too. Only one missing is this one.

What is the Rule ID value for the level 5 “sshd: authentication failed” alerts?
How many security events remain after filtering out the host-based anomaly detection (rootcheck) events?
What is the location of the log file where the brute force events were recorded?
the rule ID value is 5710
how were you guys able to find “What is the location of the log file where the brute force events were recorded?” for this lab
idk where im stuck at now. just havent had time to finish this part lol
im stuck in this one now!!
am stuck in the same guided exercise SIEM BASICS 1.2 guided exercise , WAZUH only loading 4 pages of alerts, tried refreshing to load 81 pages nothing is happening. Any help please!
Please post a screenshot of where you are stuck. Provide the current step you are doing. Thanks!
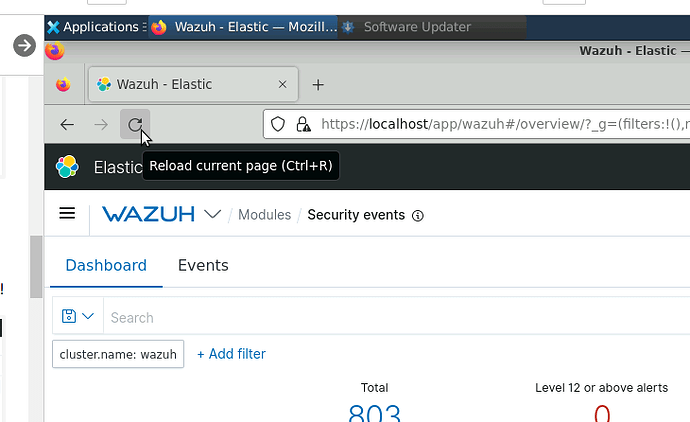
Hey there - you just need to click refresh icon to reload the page. As you can see, Wazuh is still displaying events from the current date, rather than from within the date range you just set in the previous steps (sometimes it gets it right, sometimes it needs a refresh).
I just re-ran these steps myself - refreshing should get you the expected 81 pages.
It’s a bit confusing as there is a Refresh Icon (part of the browser) and the Refresh button (part of Wazuh). In this case you need to use the Refresh Icon as noted by @CalmQuail2332 above.
Hi there, I did refresh it but still same problem. This is now 4th time trying to do this Lab getting same results. Instructions were followed to the letter.
Could you please provide the following screenshots? I would recommend entering full screen mode in your browser so more of the Wazuh UI is visible in your browser viewport.
- The Wazuh Security Events Dashboard - specifically the Time Range filters at the top after clicking Update.
- The Wazuh Security Events Dashboard - specifically the Security Alerts list at the bottom.
Refresh the browser using the button indicated in Joseph’s screenshot
- The refreshed Wazuh Security Events Dashboard - specifically the Time Range filters at the top.
- The refreshed Wazuh Security Events Dashboard - specifically the Security Alerts list at the bottom.
Yes, I need help I have one disconnected agent NOT an active agent. I refreshed it several times and restarted the entire lab and still got the same results.
Thanks

