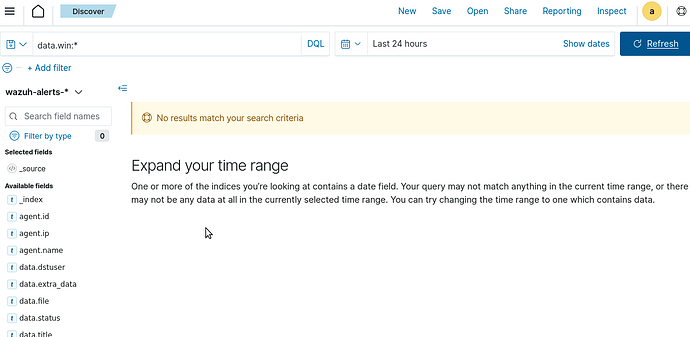
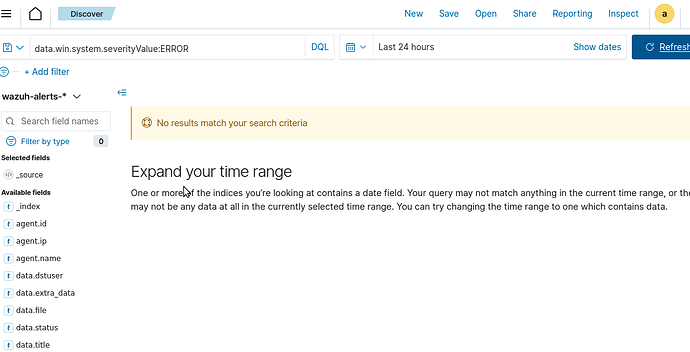
so i am really kinda frustrated at this moment , if you give me an instruction to follow, and i do exactly as requested. it does not give me what i expect according to you instructions . e.g, i did this query ( data.win:*) but is says EXPAND YOU TIME RANGE . but you said earlier (By default, Wazuh looks at the last 24 hours. We will want to adjust this time frame later in the lab, but leave the date and time as is for now) at this point i can’t pull any query and even when i do the next query (data.win.system.severityValue:ERROR), its still dont work, it tells me same thing EXPAND YOUR TIME RANGE, I then now decide to play with the time range thing, yet same error. please what is going on here? please everyone ,is anybody else feeling my pain because this is holding me back and spoiling the fun for me to look forward to get on my system to study because i’m not moving forward. @CYBRARYANKIT635 @Cybrary20231
I will run though this lab today and make sure it’s working as expected.
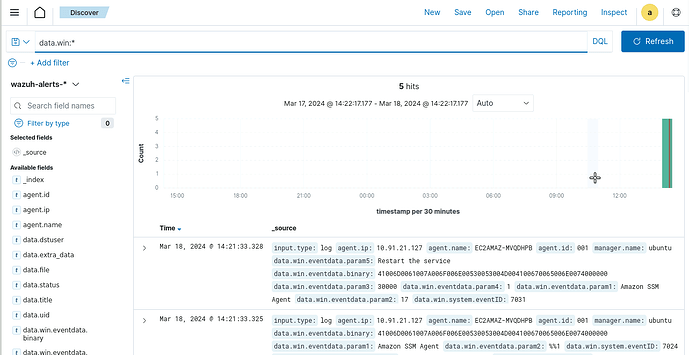
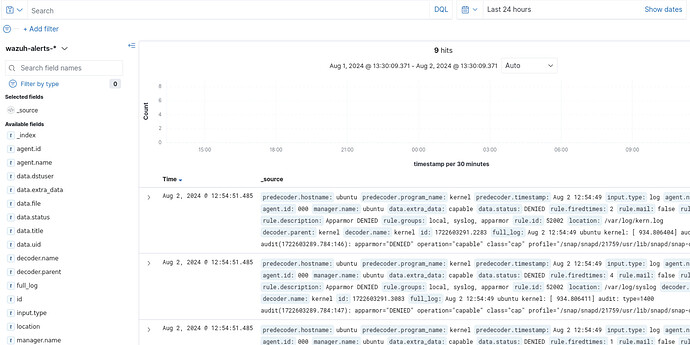
So when I run the lab, I first connect Windows to Wazuh per the instructions. Then when I check data.win:* I see…
Now, it can take a minute or so (sometimes) for Wazuh to see some Windows alerts. I have seen cases where there were no alerts immediately but then they start to flow in shortly. From what I can see the lab is functioning.
I just hit refresh and even more logs have come in:
One minor nit I have with the lab is that it should start you on the Wazuh server and not the Windows server. You need the IP of the Wazuh server first. It’s not a showstopper, but I imagine this may cause some confusion.
Here is what I see when I expand the time range:
Now one thing I am doing that is not called out in the lab is to click the REFRESH button. I think this may be part of your issue (and I’m blaming the lab steps here not you).
I am going to add some clarification to the lab steps.
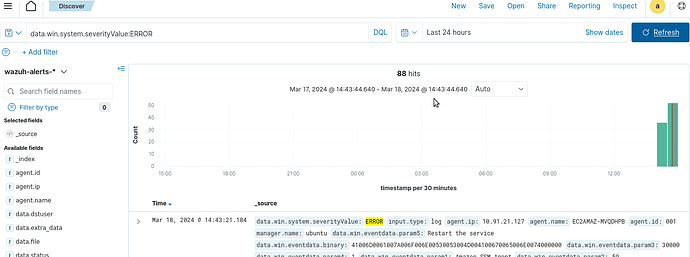
Here is what I see for the data.win.system.severityValue:ERROR
As a little time passes more and more logs come in.
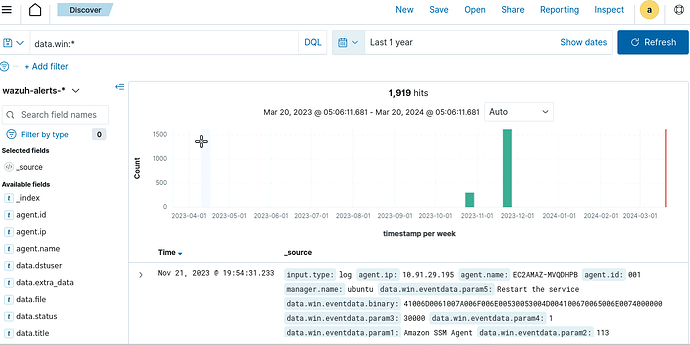
i have done exactly and follow steps , yet its not working for me, have refreshed many times and yet noting came up, i even changed times ranges yet nothing but when i change time range to 1 year it will show but its not showing me current logs so i can use to answer my task…
so when i do the 1 year, it gives me this
now i going to try the other query and see what its gives me
when i ran this , this what happened
this is frustrating me , i’m stuck on this now for 3 days and not able to move forward.this is discouraging me already
Hi, I’m running through this course just now, a small update is required here.
In Step 1, its states “By default, Wazuh looks at the last 24 hours. We will want to adjust this time frame later in the lab but leave the date and time as is for now.”
Shortly after this, moving on to Step 2 ( Part 2: Apply Search Expressions), which is using the default time range of the last 24 hours, no “data.win*” fields show in the available fields list. You NEED to modify the timeframe to see the data.win fields, this step is omitted and so should be included.
I.e:
# Part 2: Apply Search Expressions
In the next part of the lab, you will apply a series of search expressions to surface different alerts.
1. 2. In the Search Bar, type data.win: and click the blue Refresh button to show all current Windows-related alerts.*
Needs to be changed to:
# Part 2: Apply Search Expressions
In the next part of the lab, you will apply a series of search expressions to surface different alerts.
1. Adjust the timeframe from the default ‘24 hours’ to the last ‘1 year’ and refresh.
2. In the Search Bar, type data.win: and click the blue Refresh button to show all current Windows-related alerts.*
Here is a snapshot of the available fields based on the default time range:
Thanks!
Also:
Part 2: Apply Search Expressions, Step 5 is likely redundant, this should be Step 1 as I suggested in my previous message.
Part 2: Apply Search Expressions, Step 8 returns no events. searching for EventID 4624 OR targetUserName:administrator work individually, but not together, so this will need to be re-written or the time value modied to a range where both events co-exist.
Step 14 also fails to return eventID: 4624 events that are NOT by SYSTEM, I.e capturing the RDP session logon via Remmina RDP from the Wazuh host, which shows in the Event Viewer on the Windows host. Possible event ingest issue?
The lab is crashing quite consistantly as well. I’m going to skip this at the moment as I think the content and the hosts need a full check. ![]()
I am experiencing the same issue of no alerts showing after querying for data.win* . I have started the lab over several times, adjusted the time range from 15 minutes to 1 year and I get the below result. What else can be done @JosephWhite ?
For those having issues in Part 2, please check the following:
Be sure you have completed the Before you begin steps:
Note: your lab IPs will be different.
Be sure you see 1 active agent in Wazuh when you log in:

Every time I have run this lab I see events for data.win:*:
What happens if you do not see 1 Active Agent?
All I see is 1 Disconnected agent
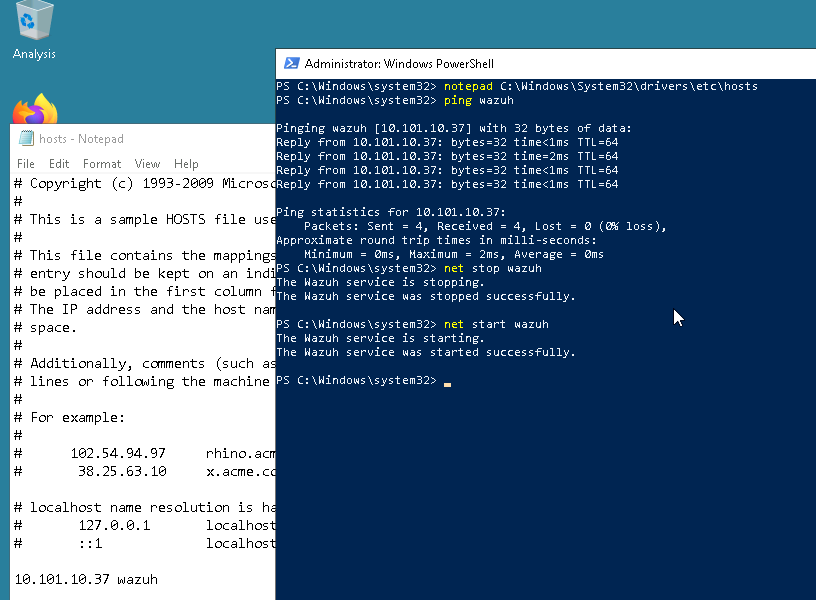
If you’re not seeing an active agent, you probably need to revisit the Getting Started portion of the lab and verify that you’ve configured the etc/hosts file correctly. If the issue persists, can you share a screenshot of the hosts file?
Hi Im having the same issue but when I put ping wazuh it says could not find host wazuh. please check the name and try again. And im only seeing 1 Total Agents and 0 Active Agents. And I not seeing the data.win.
Hey there - it sounds like you may need to revisit the steps in Getting Started, specifically the edits to the etc/hosts file on Windows.
Thank you All! I am glad I came here! I am currently working on this lab and so far it’s been day 2! The first issue I run into, is replacing the 10.A.B.C with the IP address for the Wazuh server in the notepad (Question #7).
I been adding # for this server like the local hosts above and align the IP as the others above. I see how @JosephWhite has included this information. Thanks for including the screenshot for this and the 2nd part of the lab. I will look at this lab tomorrow. ![]()
Thank you, I figured this lab out! I am now working on the Wazuh self expression lab.
